Median prices at

TzaraNext, a true breakthrough in stock market prediction
TzaraNext™ is the first and only tool that allows true predictions of financial instruments (stocks, futures, indices, forex, commodities). Forget about technical analysis, graphical analysis, algo trading... They simply do not work.
TzaraNext is a charting software built around TzaraNet™, a superior mathematical prediction tool resulting in visual charts. These charts show topological networks of curves. Analyzing them allows one to make extremely accurate and reliable predictions. It is time for "topological analysis"!
People have a hard time believing that predicting the price of a stock is possible. Well, it is now. Do not take our word for it, just browse the website, read about the tool and take a test trial of the TzaraNext software. But please do look very carefully at the charts. This is when you will start to understand how it works...
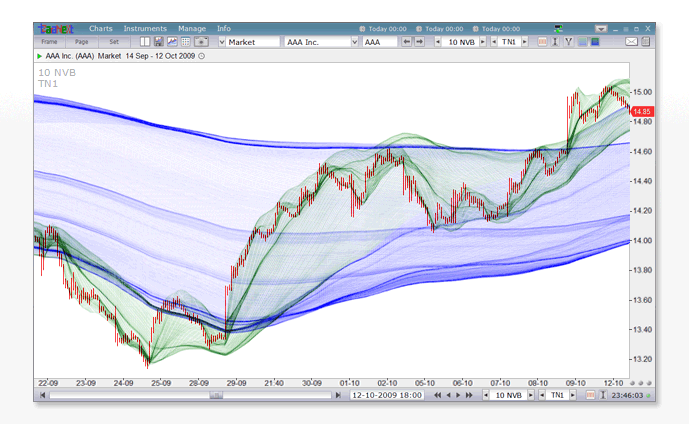
TzaraNext software takes you to a new level of prediction, thanks to TzaraNet charts. Look closely. Don’t you see something peculiar going on between the price (in red) and the network?
Here is a more striking example to help you figure out what is going on. That’s right, the price interacts with the topological network in a unique way, which we will explain on this website.
Let’s start with a very simple example. You can see that the price bounces off denser areas of the network. These areas are called "characteristic figures". Don’t panic, it’s simpler than it sounds.
TzaraNet is very powerful because the price is literally driven from one characteristic figure to another in a predictable and very accurate way. See how precise and predictable it is below.
Let’s try to understand better how TzaraNet works. The price is driven by the most marked characteristic figures. But you will see that less marked ones do the same on a more local level.
Large price movements, when looking closer, can be decomposed into smaller, more localized, movements produced by less marked characteristic figures.
TzaraNet, unlike the other tools, keeps producing the same effects when inputting data of a different nature. See below a comparison of the network using minute bars and volume bars.
The beauty of TzaraNet is that the network "adapts" to the type of data used. This is due to its topological nature. When the data is not too different, the network retains most of its elements.
Not only is TzaraNet predictive, but it is also of utmost precision. Even the tiniest price movements are driven by characteristic figures. See the degree of precision in the circled areas.
Again, when looking closer, the less marked characteristic figures interact with the price with the same degree of precision. This is a necessary condition for the "self-similarity" seen in TzaraNet.
TzaraNet exists under different subtypes (TNs), which provide even more prediction power. Each TN brings its own set of characteristic figures, always complementary, never contradictory.
Sometimes, lower TNs, such as TN1 and TN2, do not exhibit many characteristic figures. This is where higher TNs come in handy, as in the example below. Confronting TNs is very useful.
TzaraNet’s ability to allow prediction relies partly in the topological network’s self-similarity-like properties. Irrespective of the data granularity (resolution), the same patterns reoccur.
No need to be an expert to see that the two charts below, despite being in very different resolutions, share the same pattern. This one happens to be called an "umbrella".
You now know that there are patterns that reoccur. Below are examples of very common and easy-to-identify patterns. Knowledge of these patterns accelerates prediction analysis process.
Patterns are basic configurations, made of characteristic figures, that keep coming up. There are also more elaborate common configurations (modes and scenarios) made themselves of patterns.
Each TN provides a different topological configuration for a given data set. While some elements are preserved when changing TNs, others are specific to a TN, providing additional information.
In the example below, each TN brings very valuable elements. The way the elements complement each other increases the quality of the prediction.
Because TzaraNet is resolution insensitive (a necessary criterion to validate a system), TzaraNext offers Normalized Volume Bars™ (NVBs), superior alternative to minute bars.
When the market is particularly volatile, even though TzaraNet keeps working, minute bars are suboptimal. NVBs tend to be superior in general, and are a must-have for volatile instruments.
TzaraNext offers 8 predefined resolutions (4 minute resolutions and 4 NVB resolutions) to make life easier for you. Displaying an instrument under different resolutions enhances prediction.
Below is a volatile instrument displayed in all 8 resolutions. By confronting them all, it is possible to make accurate predictions in the short, medium and long terms.
Thanks to its multi-threaded architecture, the TzaraNext software works very fast and is designed for multi-monitor environments.
… TzaraNext is designed for even more monitors. There is virtually no limit to the number of monitors, other than imposed by your computer hardware.
TzaraNext introduces Turnaround Alerts™, a new type of alert taking full advantage of the characteristic figures and patterns of TzaraNet. These alerts warn the user of trend reversals.
The Turnaround Alert below (Upturn) was triggered, after the price bounced off characteristic figures, thanks to strategically positioned alert price lines.
| TzaraNext software takes you to a new level of prediction, thanks to TzaraNet charts. Look closely. Don’t you see something peculiar going on between the price (in red) and the network? |
