Median prices at

Characteristic Figures
Characteristic figures are elementary structures of three types within the topological network. The major type of characteristic figures, cords, are marked condensations of curves. The second type, envelopes, are network boundaries. And the third type, boltropes, are both cords and envelopes at the same time.
Characteristic figures "attract" and "repel" the price strongly and precisely in predictable ways. This is what makes accurate predictions possible. Characteristic figures are at the origin of "patterns", which are recognizable basic topological configurations that allow bypassing fastidious analysis of interactions of characteristic figures with the price.
Understanding well the effect of characteristic figures, and in the particular cords, on the price is the first step to making predictions.
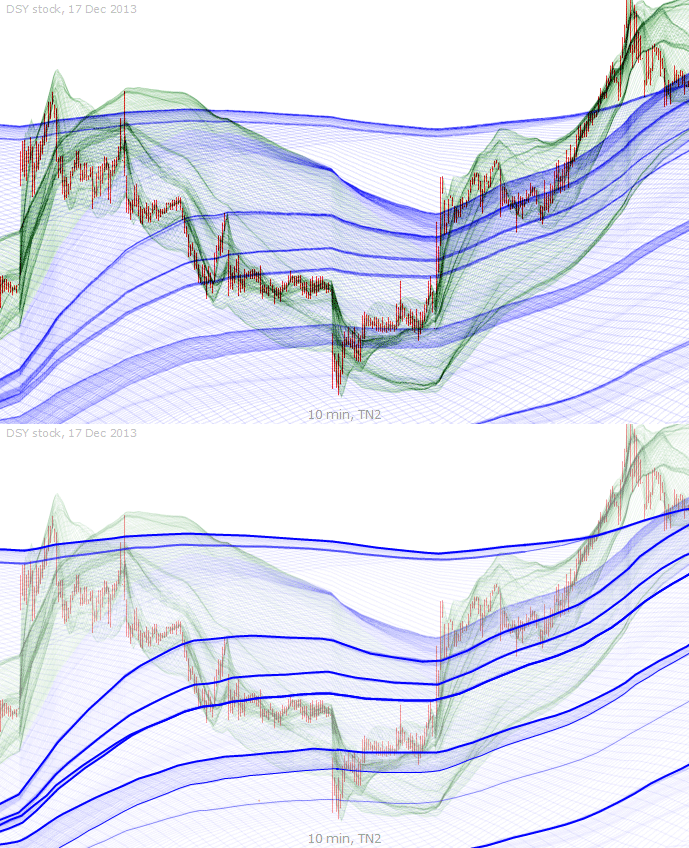
Major cords have been highlighted. Usually, the denser the cord, the stronger its effect on the price. Observe how the price moves from cord to cord, touching and bouncing off each one.
As a general rule, the price bounces off cords, but it can also travel right through and stop in a symmetrical fashion, as with the thick blue cord. Green cords are simply "shorter-term" cords.
The envelopes have been highlighted. Note that a network boundary is not always at the outer edge of the network. This explains why envelopes can be found within the topological network.
The boltropes, highlighted below, are technically speaking both cords and envelopes. In practice, their effects are comparable to cords. They more often tend to be embedded than envelopes.
One might think that the bottom cord on the 1 NVB is a boltrope, but one can see, thanks to the higher resolution, that it is indeed a cord. In any case, notice its very powerful effect.
In this series of charts, the interactions of the most important cords with the price are shown by the pink arrows. When two arrows are used conjointly, it generally identifies a sticking section.
The interactions of envelopes with the price are marked with a pink arrow in the present series of charts. Green envelopes correspond to shorter-term envelopes, producing more localized effects.
Boltropes are rarer. Just like cords, the thicker the boltrope, the stronger the effect. In these examples, beautiful boltropes are present and marked with pink arrows.
Once you have understood that characteristic figures attract and repel the price, you are one step closer to being able to use TzaraNet to make predictions. This animation is here to help.
Observe the simplicity and precision of the effect (red arrows) of characteristic figures (blue and green lines) on the price. Effects are attractions, repulsions, and sometimes, adherence (sticking).
| Major cords have been highlighted. Usually, the denser the cord, the stronger its effect on the price. Observe how the price moves from cord to cord, touching and bouncing off each one. |
