Median prices at

- TzaraNext Software
- TzaraNet Charts
- TNs (Curve Subtypes)
- NVBs
- 8 Resolutions
- Full Multi-Screen Support
- Linking
- Turnaround Alerts
- Software & Customer Support
- Other Important Features
- System Requirements
Test Trial
Try TzaraNext for free
- All options
- 15-day trial period
-
Linking
The "linking" of charts, is a powerful feature that allows you, with a click of a mouse, to connect any charts from any monitors so that they can share any parameter. When charts are linked, if a chart parameter (instrument, TN, chart resolution or chart date) is changed, it is changed simultaneously on all the linked charts of the same linking group.
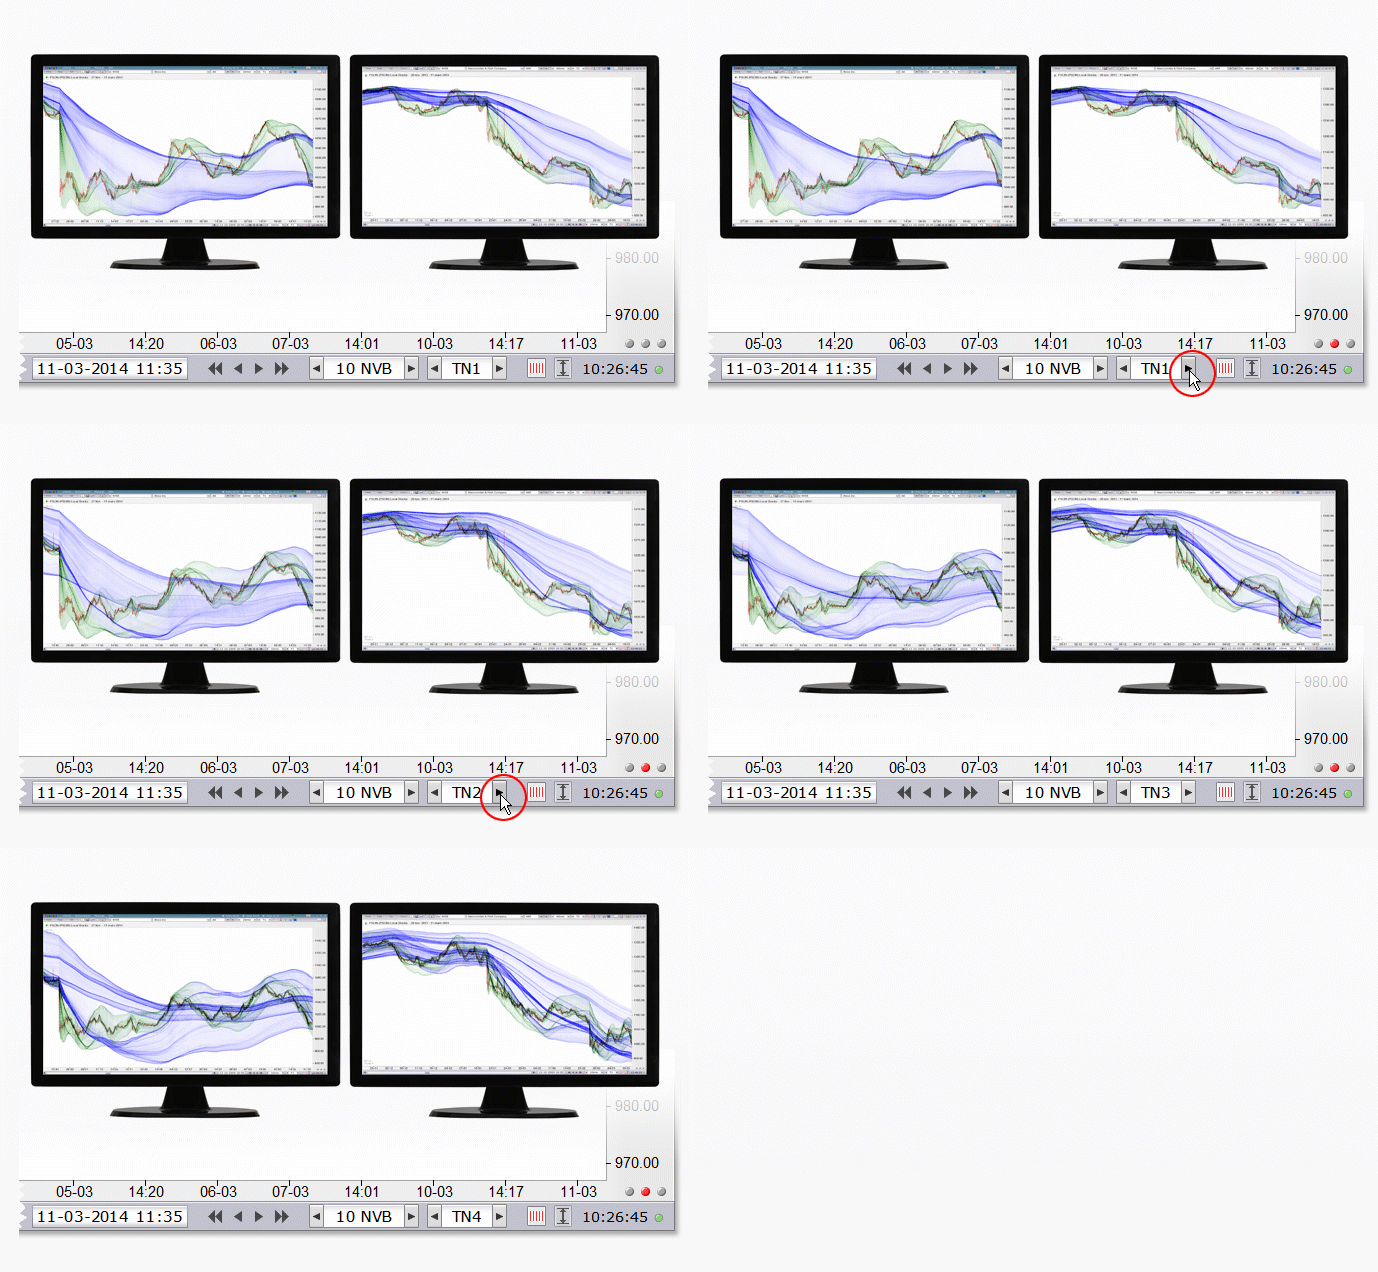
Linking, which consists in connecting charts, can be used across monitors, as in this example, where the user changes the TN, and the new TN is simultaneously applied to both linked charts.
Displaying all four resolutions for the same instrument and linking them all, in order to scroll through TNs all at once, is one of most useful methods of analyzing an instrument.
Another interesting usage consists in linking several instruments and applying the same parameter to them, as with these four stocks and the TN.
Another parameter that is useful to change when charts are linked is the resolution. Any control can be used to do so, such as the resolution box menu.
| Linking, which consists in connecting charts, can be used across monitors, as in this example, where the user changes the TN, and the new TN is simultaneously applied to both linked charts. |
