Median prices at

- TzaraNext Software
- TzaraNet Charts
- TNs (Curve Subtypes)
- NVBs
- 8 Resolutions
- Full Multi-Screen Support
- Linking
- Turnaround Alerts
- Software & Customer Support
- Other Important Features
- System Requirements
Test Trial
Try TzaraNext for free
- All options
- 15-day trial period
-
Other Important Features
Even if TzaraNext's main function is to display TzaraNet charts, it is nonetheless a comprehensive software that has many useful functionalities. First, it contains all the controls to handle charts. One can request Times & Sales, manage portfolios (custom lists of instruments), place price lines and alerts, request bulletins (prediction reports), contact customer support, and do much more.
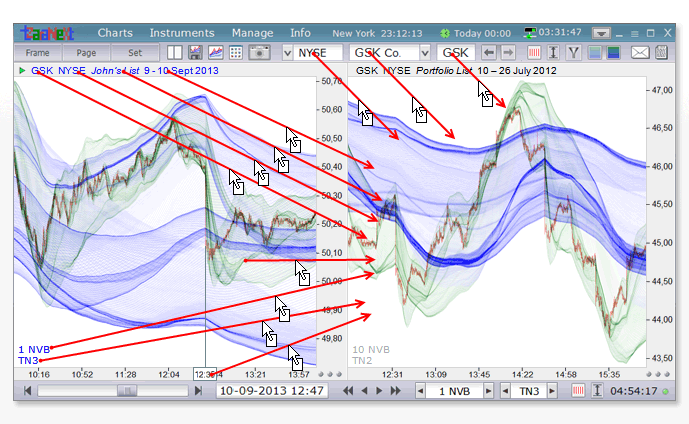
Besides classic and more elaborate controls, any parameter can be dragged and dropped on one or more (linked) charts.
When charts are polluted by bad data, a filtering function can be turned on to clean up the bad data and display the fixed topological network, as can be seen in this example.
It is sometimes convenient to modify the contrast of the displayed topological network if it is too dark or too pale. This function can be used temporarily on any chart, or continually on a monitor.
Placing, moving, and deleting vertical lines, horizontal lines or Alerts can be done with a click of a mouse...
… or through a dialog box, which allows one to manage all the price lines and active alerts centrally.
Requesting Times & Sales is very easy. Just click on the bar for which you want to display the corresponding T&S. There is also a T&S dialog box where any symbol and date can be input.
One can create as many portfolios (lists of instruments) as wished, manage them easily, and use them to display the corresponding charts.
Managing each user account for corporate customer accounts is done easily, directly through TzaraNext. This dialog box allows one to add new users, add or remove markets or options, etc.
To contact or be contacted by the customer support, full messaging functionality is present.
Users can order bulletins, which are short prediction reports, thanks to a special dialog box. Bulletins to be ordered can be either standard or custom.
| Besides classic and more elaborate controls, any parameter can be dragged and dropped on one or more (linked) charts. |
