Median prices at

Pattern Recognition
Patterns are basic configurations, made of characteristic figures, that reappear frequently. By recognizing the beginning of a known pattern, one can predict precisely the future evolution of the price. Having a catalogue of patterns in mind speeds up the analysis process by bypassing the detailed analysis of each individual characteristic figure.
This process is pattern recognition. It is a more global way of analyzing topological configurations than through characteristic figures. In practice, the brain mixes in a natural manner pattern recognition and analysis of characteristic figures. This makes sense after all since patterns never reproduce themselves strictly identically.
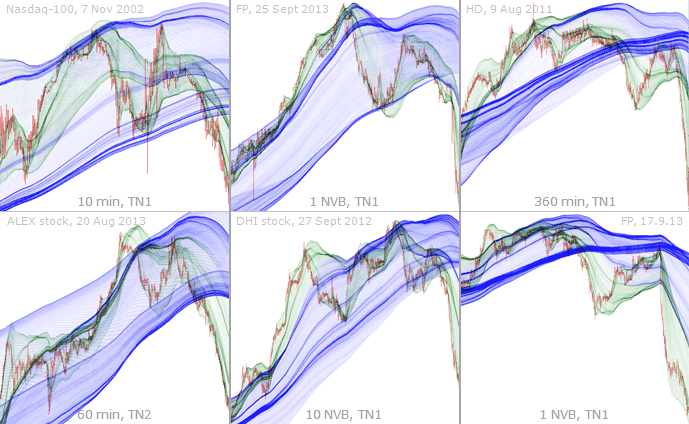
No need to be an expert to observe that these configurations are very similar, particularly the charts of each top-bottom pair. This pattern is called an umbrella.
After an umbrella and other downturn patterns, upsurges abruptly stop at the first strong cord before plunging back down. This pattern is called a false recovery.
Here is a baseball cap pattern, seen when an "umbrella", whose top cords have a horizontal or even positive slope, is followed by the price returning to these cords.
In the relative absence of cords, a strong top cord will lead to a rebound off of it. The stronger the cord, the stronger and more precise the rebound. This is simply called a "top cord rebound".
The same phenomenon also happens in the other direction, this time forming a "bottom cord rebound". Here again, the stronger the cord, the cleaner and stronger the rebound.
These "trend reversal" patterns are easy to identify. They consist of a few jumps in an environment scarce in characteristic figures, with possible sticking sections, after a long fall.
Here are other examples of trend reversals fitting the previous description. Note how similar the charts of each top-bottom pair are.
These other trend reversals consist of a first rebound off a thick bottom cord, followed by a rise around an emerging short-term pack of cords. It is impossible not to anticipate such upturns.
When characteristic figures concentrate with the price trapped inside, a (here, "top") "buildup exit" occurs, characterized by one or more rebounds on emerging cords or the top of the pack.
Below are other similar top buildup exits with nice rebounds on emerging cords. Note how similar the patterns of the left charts are.
Sometimes, a cord starts forming and the price wraps around it until the cord gets very thick and dense. This constitutes a "directional rise". It is, incidentally, usually followed by a sudden drop.
When parallel characteristic figures get closer, the price can start bouncing around inside them ("channel"). The end of this movement is abrupt and the direction can be predicted by the cords.
Top buildup exits in a scarce characteristic figure environment can lead to "thin air journeying", where the price jumps freely and starts journeying until it reaches an (often thick) emerging cord.
There are also "thin air jumps", where the price rises freely, and then fall sharply until it reaches a strong enough cord to land on. Such thin air jumps can be caused by news or other events.
When characteristic figures are concentrated, a trip underneath the bottom part of the network usually results in a dramatic unstoppable "drop" (until a long-term cord is reached for example).
Sudden jumps out of nowhere can be predicted by the presence of a gradual thickening of a bottom cord around which the price wraps. This pattern is a "fall brake".
Below are strong and easy-to-identify fall brakes. As usual, they are followed by takeoffs, often with minor rebounds off emerging small cords.
Similar to the fall brake, there is the "rise brake". It is a drop following the darkening of a rising directional cord. This pattern, symmetrical to the fall brake, is much rarer than the latter.
Modes are different from patterns in that they do not have a given shape. However, they have distinctive traits. In "steps" mode, the price jumps from one cord to the next.
The "stationary" mode appears as alternating movements inside the network, which tends to be tight and parallel. It is impossible to make any interesting prediction while the mode is stationary.
Scenarios are juxtaposed patterns in a logical succession, when the network is simple with marked characteristic figures. Below are various classic scenarios that occur from time to time.
| No need to be an expert to observe that these configurations are very similar, particularly the charts of each top-bottom pair. This pattern is called an umbrella. |
