Median prices at

Precision
One of the major specificities of TzaraNet is its extreme precision. We are not here talking about percent precision, but precision rather in the range of per thousand and even per 10 thousand. When looking at charts, this strikes people immediately. The price bounces off cords and other characteristic figures repeatedly with pinpoint precision, as if they were literally magnets. With a little bit of experience, predictions will become more and more reliable, but also more and more precise.
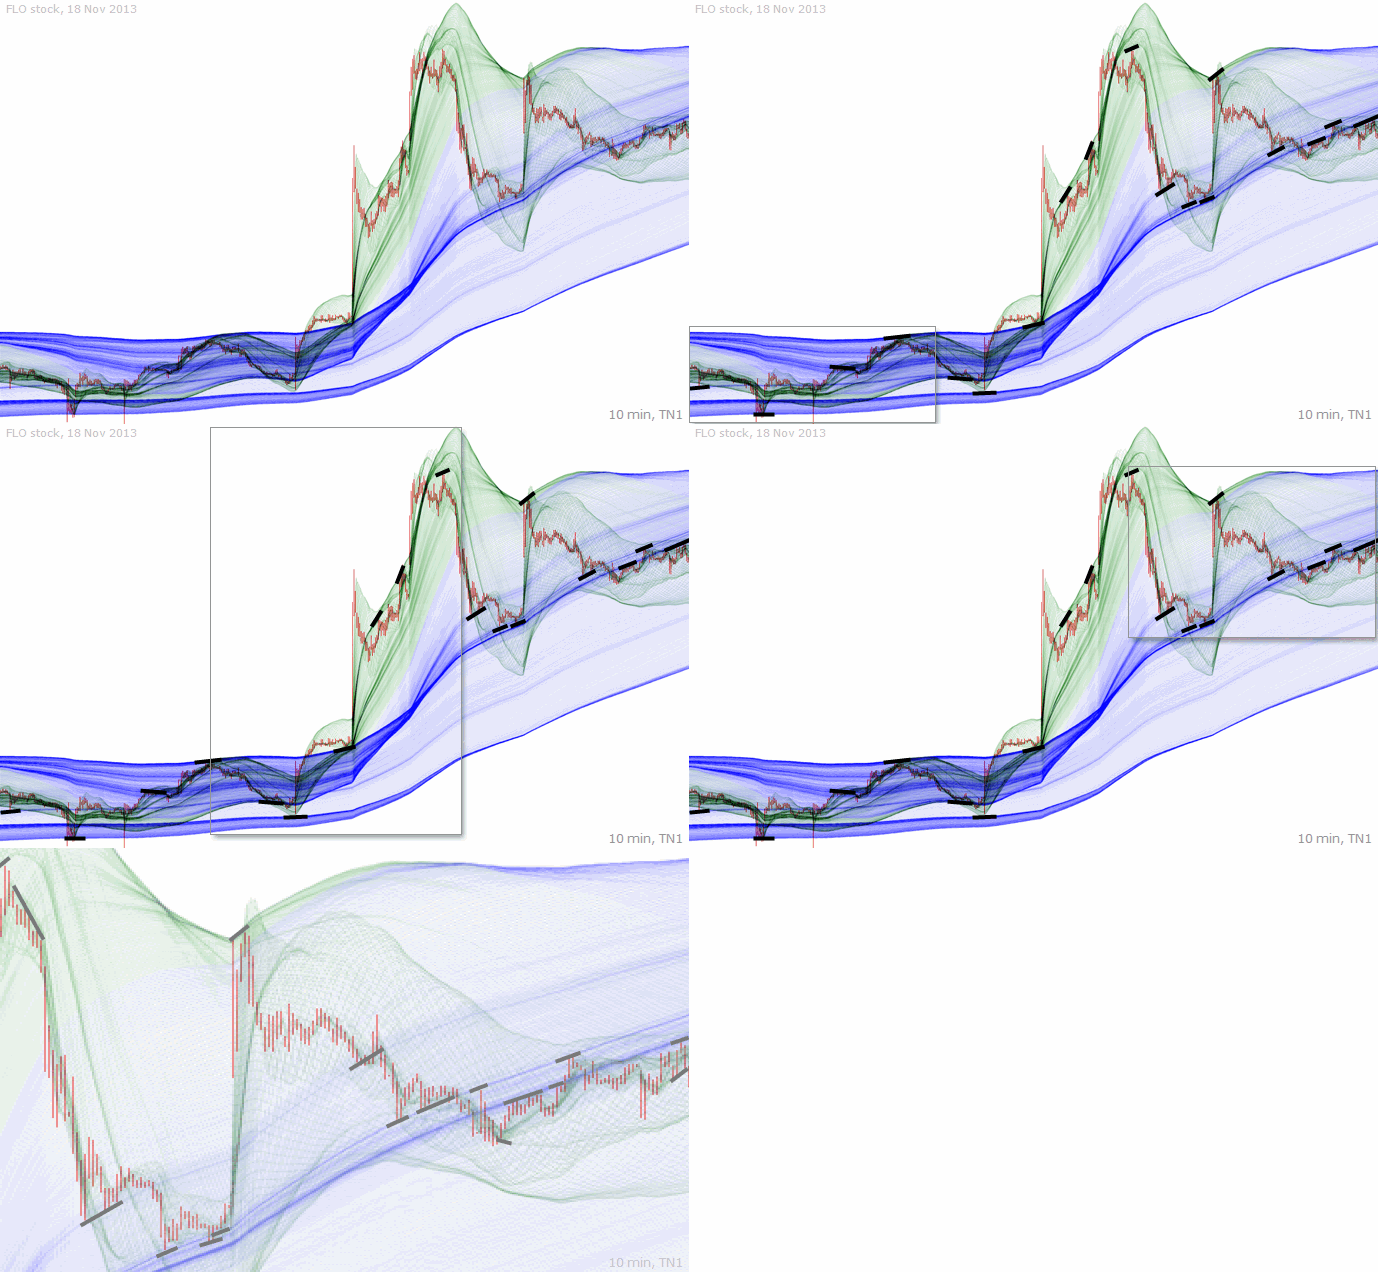
For anyone who is not convinced by the extreme precision (see black line segments) of TzaraNet, just think of the probability of the price touching a characteristic figure 100 times in a chart...
No need to zoom in to appreciate the amazing precision of interactions, even with long-range price movements. Note that NVB charts tend to exhibit even greater precision.
No matter which TN you choose, the precision is the same. As long as the price interacts with a characteristic figure (which happens if strong enough), the price always precisely bounces off it.
To illustrate the previous remark, you can see in this example the precision of the interactions in a single chart under each TN. Note that the higher the TN, the greater the number of interactions.
See how complementary two TNs displayed side by side are for accounting for the local extrema. But observe also the extreme precision of the interactions on both TN2 and TN3 charts.
If you look closely, you can spot other very precise interactions of minor importance with less marked characteristic figures. Here, only major interactions have been highlighted in black.
Interestingly, a local extremum can interact with more than 1 TN, each time with great precision. At least 9 occurrences of local extrema interacting under 2 different TNs can be seen here.
Even with extremely volatile instruments, precision is completely intact throughout all the TNs, as one can see on this futures instrument under 4 different TNs.
And this is never a coincidence. It repeats itself over and over, as it does a little later on in that same volatile instrument. You can also observe here the precision under TN5.
In these last three examples, "imprecise" interactions are boxed in red, whereas precise, spot-on, interactions are boxed in black. You can easily compare the number of occurrences.
Note that an interaction boxed in red does not necessarily mean that it was imprecise. It likely means that either the local extremum interacted with another cord under a different TN or...
... a longer-term cord, or some very localized "background noise" (a tiny volatile price artifact) removed some precision. Of course, such artifacts can also be misinterpreted, but it is very rare.
| For anyone who is not convinced by the extreme precision (see black line segments) of TzaraNet, just think of the probability of the price touching a characteristic figure 100 times in a chart... |
