Median prices at

Resolutions
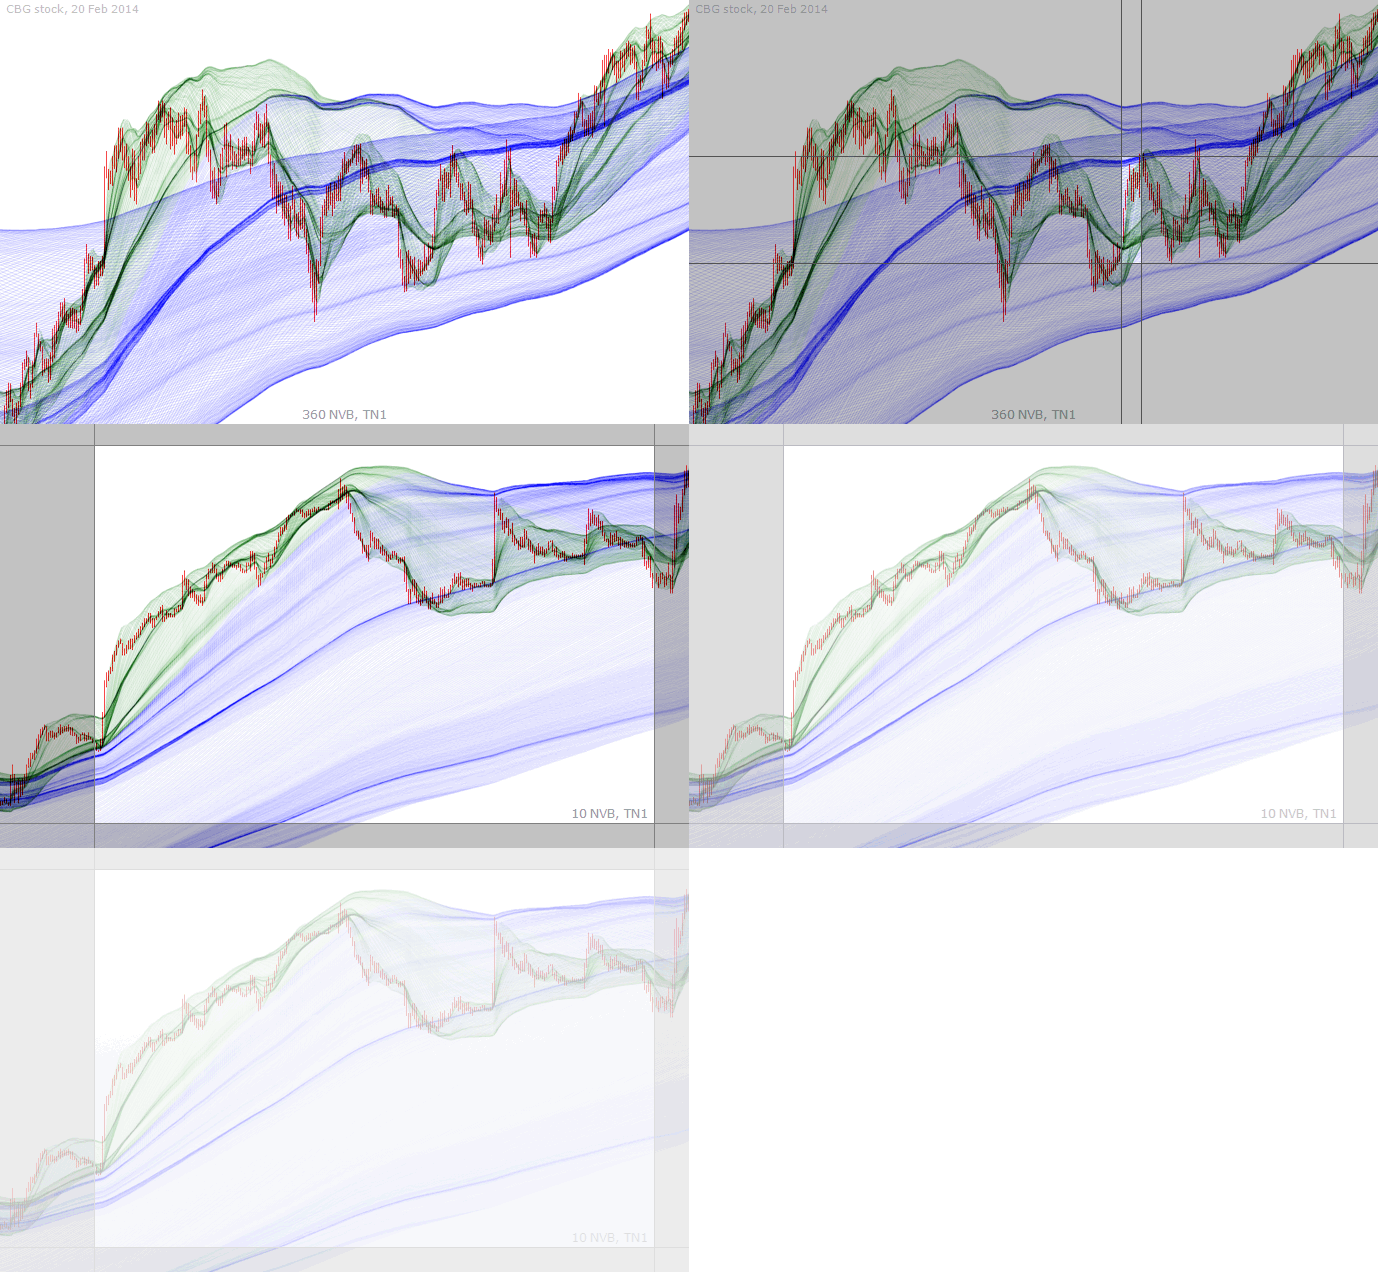
Resolutions do not matter to TzaraNet in that the topological network’s appearance and properties are unaffected by the granularity of the data (within a reasonable range of the granularity). However, displaying TzaraNet under several descending resolutions provides in a zoom-in effect without obscuring the topological network with too many characteristic figures, over too wide a range of timeframes. This may sound a bit cryptic, but the illustrations that follow should make this concept very easy to grasp.
Resolutions allow us to observe not only the self-similarity of TzaraNet, but allow us also to observe topological networks at different scale, as if zooming in and then refocusing.
Here, to illustrate this idea of a continuum in TzaraNet in both spatial directions, a large portion of the network is shown inside the network at a larger scale. See the 2 cords from the 60 min.
Showing corresponding topological networks of different levels of granularity side by side is a simpler way of seeing how the smaller scale network is embedded in the larger scale one.
Once the 1 NBV structure has been identified in the 10 NBV structure, one can see how the 1 NVB local extrema are actually the results of interactions with cords present in the 10 NVB network.
Because the difference in granularity between the charts here is superior, the whole lower part of the 1 NVB network corresponds to a concentrated and strong interaction in the 60 NVB network.
At a slightly later date, other 1 NVB local extrema can be seen on the same 60 NVB chart, again strongly and precisely interacting with a cord present on the 60 NVB topological network.
Interestingly, a local extremum (green circle) can interact simultaneously with cords from very different scales. Observe the local extrema in pink, and how it rebounds on the 60 min chart.
This time, confronting 10 min and 60 min topological networks, one can observe, again, a rebound (the 10 min local extremum), which hits the thick blue cord of the 60 min network.
Here, in contrast, it is a cord at the top of the 60 NVB topological network that accounts for the local extremum (circled in red) seen on the 10 NVB network.
When such a strong boltrope exists on a chart (60 min here), you can be quite sure that the price as seen on the shorter timeframe chart will stop right where that characteristic figure is located.
If, sometimes, most of the local extrema do not exhibit interactions with characteristic figures, as on this 10 NVB chart, it likely simply because the interactions are coming from "longer" cords.
These 3 apparently aligned local extrema are no mystery when the corresponding longer scale chart is displayed. The thick blue descending cord explains what was seen on the 10 min chart.
This is another example where many local extrema can only be understood in view of the longer resolution chart. Cords tend to be scarce in "drops", which makes higher resolutions useful.
| Resolutions allow us to observe not only the self-similarity of TzaraNet, but allow us also to observe topological networks at different scale, as if zooming in and then refocusing. |
