Median prices at

Self-Similarity
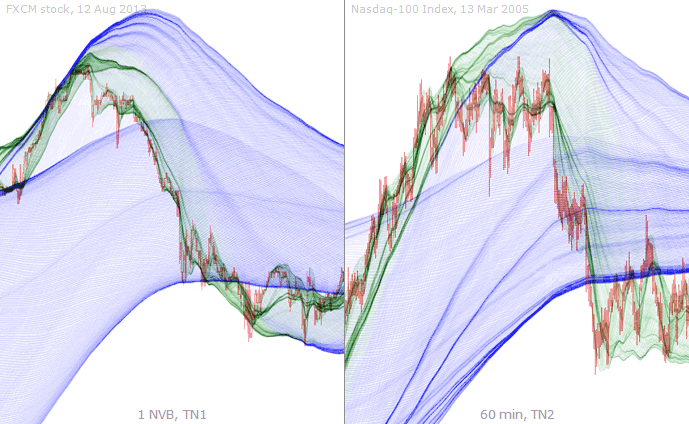
The TzaraNet topological network is resolution insensitive. In other words, one cannot tell apart one resolution from another based on the appearance of the topological configurations (patterns). Furthermore, similar patterns repeat themselves whatever the resolution, from the lowest to the highest. It is this property that allows us to talk about "self-similarity".
The self-similarity of TzaraNet make predictions much easier because the number of different patterns is unaffected by the number of resolutions used to build topological networks. One set of patterns is all it takes to analyze any chart.
Let there be no mistake, there is no such thing as fractals in the price or charts, but extremely similar patterns, such as the one below, occur under different resolutions at different times.
The self-similarity of TzaraNet makes the pattern below (called an umbrella) come up from time to time in any resolution (here in 10 and 60 minute), and even under different TNs.
This is another classic pattern (called a baseball cap) that illustrates self-similarity, here between 10 and 60 minute. In the next section, this pattern will be discussed.
You can see that the self-similarity, though approximate, is precise enough so that, within a given pattern, one can always find configurations that are very close to a previously observed one.
Here is another good match between two configurations under different resolutions. It happens to be a common pattern called a false recovery.
This animation shows excellent matches of trend reversals. This pattern is called a "fall brake" with return to cord, which indicates that self-similarity applies even to complex patterns.
These 1 NVB and 60 min configurations are decent matches for a "top cord rebound" pattern, another classic one although not the most common.
Self-similarity, as we saw two images ago, can apply to more complex patterns, such as in these beautiful "foot" patterns. A foot is one of the patterns associated "trend reversal".
More common is the "return to cord" pattern, so much so that extremely similar configurations can be seen, such as in these examples of 1 and 10 NVB charts.
Even between very different TNs, same configurations can be observed, as in these other examples of the "return to cord" pattern.
| Let there be no mistake, there is no such thing as fractals in the price or charts, but extremely similar patterns, such as the one below, occur under different resolutions at different times. |
