Median prices at

What Makes TzaraNet Special
TzaraNet is a topological network in which the price is embedded, existing under five curve subtypes (TN1 to TN5), and using two colors. That's it.
It is a one fits all conditions tool, which is, in passing, a prerequisite for any tool that claims to be predictive. Quite a contrast to the existing ways of predicting, which rely on a truckload of tools that always work under different conditions than when needed.
This is an emblematic example showing how simple TzaraNet is, and how simple using TzaraNet is. What you see here begins with a nice "umbrella", and is followed by something very simple.
With this configuration, expect to see the price, especially when the driving cords start thickening, journey gently until it meets the first thick emerging cord. It couldn’t be any simpler.
Here is a relatively similar example with a little bit of extra complexity. The journeying towards the emerging cord starts after a series of predictable small steps.
The red arrows represent the "average" price movements between the major interactions. As you can see, it is not that complicated.
Another beautiful example of simple interactions between the price and the characteristic figures, with exceptional precision in addition.
See how the same cord is the starting point of the price movement, and the landing point on two occasions, with a nice sticking section, and a round-trip to the boltrope.
This example shows how simple TzaraNet is, with straightforward average price movements. We have a nice sticking section with a double round-trip. Observe also the smaller price movements.
The price oscillates around this main pack of cords, accounting for this thin-air M-shaped price movement. Confrontation with a higher-res chart would have predicted the heights of extrema.
In general, predicting with TzaraNet is about identifying interactions in order to predict price movements between them. With a bit of experience, it becomes simple to anticipate a movement.
For the major movements, these arrows help you see where they originate and where they end up. Smaller movements can also be predicted, but it requires a more in-depth examination.
Simple and typical example of a "baseball cap". The price drops, usually after a thickening of the top cords, and then, eventually, goes back up until it reaches the top of the envelope (cap visor).
There are a lot of interesting elements in this chart, but what is great is that we can keep it simple by looking at major interactions (red arrows), and still make good predictions easily.
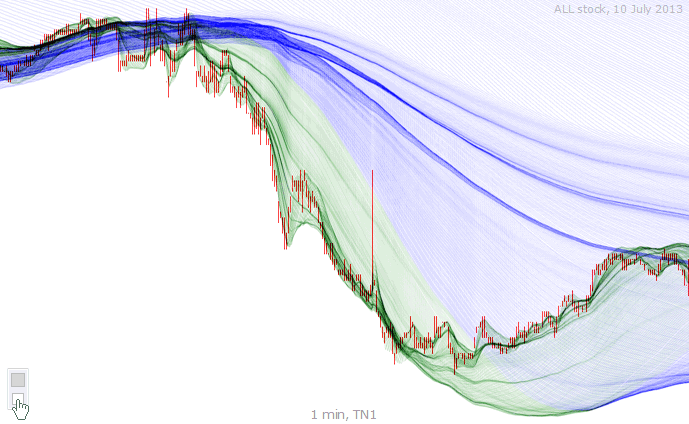
In a "foot", after a fall, the price brakes (usually after cords start thickening) and suddenly, traces an "A" between the top and bottom envelopes or cords. We can actually see a second smaller "A".
You can see below how this foot looks under other TNs. Principle extrema are still accounted for by cords, but, remarkably, secondary extrema are accounted for by cords under higher TNs.
| This is an emblematic example showing how simple TzaraNet is, and how simple using TzaraNet is. What you see here begins with a nice "umbrella", and is followed by something very simple. |
