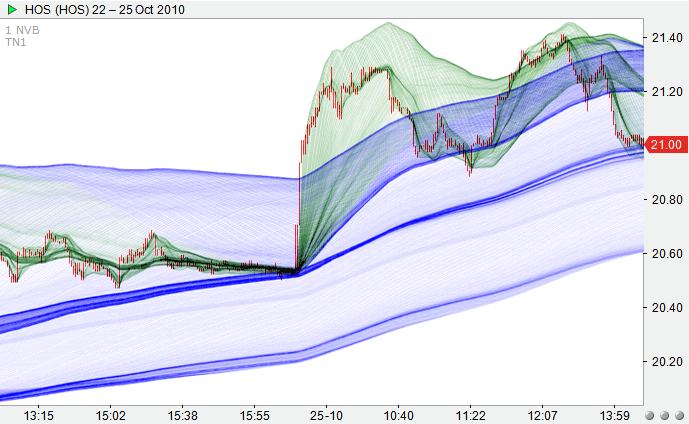
Median prices at

TzaraNet Charts
TzaraNext is built around TzaraNet Charts. This is why the interface is the least intrusive and as simple as possible. If you find it dull, this is rather a good sign. Charts controls deal with the timeframe (also referred to as the resolution), chart subtype (TN) and chart date. All this can be done in many ways, simply and intuitively. In addition, vertical and horizontal lines can be placed on the Charts, and Charts can be linked together. That's it, there is no brain teaser here.
Central to TzaraNext is the graphical unit called a "cell", that is, a chart with its scales, title bar and a few controls. To keep it simple, we will keep referring to them as charts on the site.
Up to 8 charts can be displayed on each monitor. Below is the same chart in min and NVB under 4 different TNs. Of course, charts don't look so small in TzaraNext (click here for full-sized charts).
Suppose you want to see an instrument in all 4 resolutions. Saving your chart layout for later use will save you time. Layouts can be saved using 3 different layout formats.
With saved layouts, a user would need only to click on a single button to go from the previous group of minute charts to this corresponding group of NVB charts.
There are 5 possible ways to change the TN of a chart, one of them being the use of the chart toolbar.
Splitting the monitor into two charts allow one to, for example, compare the corresponding minute and NVB charts. By linking these charts, one can change TNs or symbols simultaneously.
Moving charts, that is, changing the chart date, can be done in many ways. Here, we used the 'next chart' button, which lets you appreciate how characteristic figures drive the price over time.
You can compare the interactions of characteristic figures with the price in minute versus NVB, and under two different TNs, thanks to this 3-cell layout.
Of course, cells can be resized freely, so that one can show more or less of a chart, or stretch more or less the price scale.
| Central to TzaraNext is the graphical unit called a "cell", that is, a chart with its scales, title bar and a few controls. To keep it simple, we will keep referring to them as charts on the site. |
