Median prices at

What Makes TzaraNet Special
TzaraNet™ is a completely new and original mathematical prediction tool of unprecedented predictive power. It allows one to make qualitative and quantitative predictions of any financial instrument (stocks, futures, indices, forex, commodities). TzaraNet is embodied in the form of highly visual charts. On these charts, one sees topological networks of curves.
What is remarkable is the presence of "cords" (and other characteristic figures) in these topological networks. Cords are dense condensations that attract the price, literally like magnets. It is this property that makes predictions very precise and accurate under all market conditions.
TzaraNet may seem complicated at first, but there is a lot more to see than to read, which is not surprising since TzaraNet is all about charts. Try to forget what you read or saw before and look at Tzaranet charts with a virgin and observing eye. This is when you will start to understand how the cords attract and repel the price. If you do not understand by yourself, use this section as a manual. Maybe some buy/sell tools require less effort, but what is the point if they do not work?
You will also realize that the market is much more deterministic than previously thought. News and events have much less effect than you think. Not only is this good news for traders, but it leads to a complete paradigm shift in the field of finance and economy.
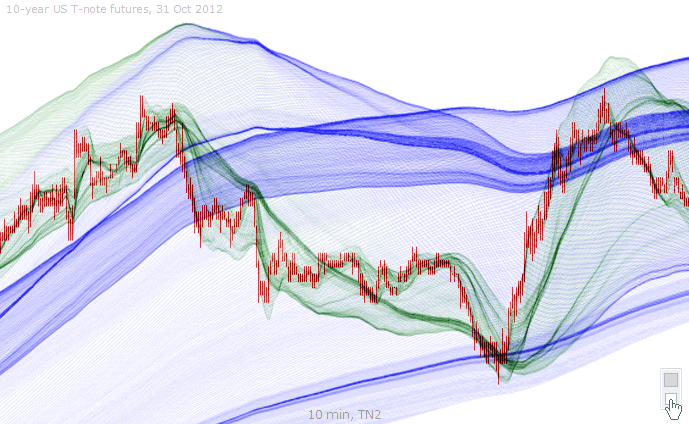
What makes TzaraNet powerful are characteristic figures. See how strongly and precisely the bottom cord exerts its attractive/repulsive effect. See bottom image for other interactions.
Major interactions with characteristic figures are highlighted. However marked the characteristic figures (cords, envelopes and boltropes), they always exert powerful actions on the price.
Observe how the price interacts with the cords, and, in particular, how the same cord can keep having a powerful effect on the price at a much later stage.
Major interactions exert a wider range of action, whereas minor interactions exert a smaller range of action. Try spotting other interactions with cords, other than the major ones highlighted.
Here, we can see a typical "price journeying" in "thin air" landing on and bouncing off a marked cord. This shows how powerful the effect of cords can be.
During this constraint-free journeying, one can see that less pronounced cords (see minor highlighted interactions) guided the price through the journeying.
This other thin air journeying is quickly guided through cords emerging from a buildup. As it starts getting guided, the effects of cords become progressively stronger. This is a typical "scenario".
The first and following interactions with the emerging cords are highlighted. Note also how the price violently jumps where the cords are merged (referred to as a "buildup exit").
These buildup exits illustrate how powerful TzaraNet is. After a sudden jump, prices always land on cords. If the journeying doesn’t meet cords, try displaying the chart in a higher TN.
Interestingly, and this is not unusual, it is the same cords that guided the price prior to the jump that are offering support to the journeying price.
This example is symmetrical to the last two charts in that the price drops violently after a buildup and comes back to the emerging cords with utmost precision.
This scenario is typical. It starts with a bottom buildup exit and after journeying, the price starts sticking to the first cord it meets. Classic jumps and channeling are seen next.
This is the same chart in TN3. What is fascinating is that the same prices lead to a different topological network with certain common elements, but playing often slightly different roles.
Observe how the price sticks in a different, but equally powerful, way to the cords. The way the two main bottom cords cross near the end is topologically different here, but it works just as well.
Displaying different TNs side by side allows for confrontation of topological elements. Since each network is different, one ends up finding a cord or envelope accounting for each price extremum.
If you compare the highlighted areas on both charts, you can see how the cords and envelopes of the two TNs are complementary (and not contradictory), making prediction superior.
Here is another example where different TNs are confronted. For volatile instruments, looking at different TNs in parallel can be indispensible, to compensate for the erratic price fluctuations.
Higher TNs often bring more interactions, but it is not always the case, as in this example. However, a TN almost always brings interactions that are not present in any other TN.
In this simple example, 4 different TNs are shown. Each one provides great information, but duee to the simplicity of the topologies, one needs to confront all four to make a reliable prediction.
The highlighted areas clearly show what each TN brings in terms of major interactions. In this example, interactions do not overlap a lot between TNs. Thus, the need for confrontation.
This simple example illustrates the idea of interactions overlapping and not overlapping between TNs. In this chart, one interaction is common to all the TNs, and one is found in only one TN.
The interaction that happens to be common to all TNs also happens to be obvious, as in any top buildup exit, whereas the other one corresponds to a major extremum seen only in TN3.
We have here apparently complicated topologies, but major interactions overlap, which gives a higher degree of confidence to the prediction. Paradoxically, complexity does not add up.
Thick strips of parallel cords often lead to an A-shaped price movement. The prediction would have been easy because the legs, and, even more so, the tip of the "A", interact in all four TNs.
| What makes TzaraNet powerful are characteristic figures. See how strongly and precisely the bottom cord exerts its attractive/repulsive effect. See bottom image for other interactions. |
